 Stocks on Bursa Malaysia closed broadly higher last Friday on massive buying in heavyweights led by Sapura Kencana Petroleum and CIMB drove the benchmark index up to end the week on a high note, after falling consecutively for five trading days. The benchmark FBMKLCI finished 20.54 points or 1.16% higher at 1,788.31, after hovering between 1,766.22 and 1,795.29 throughout the day. However, on a weekly basis, the key index fell 20.57 points from 1,808.88 on previous Friday. Gainers thumped losers 884 to 128, while 161 counters were unchanged. Total volume slipped to 2.3 billion shares worth RM2.48 billion from 2.56 billion shares worth RM2.68 billion on Thursday. Weekly turnover increased to 9.90 billion shares valued at RM10.53 billion, from 8.80 billion shares valued at RM8.77 billion last week.
 The FBMKLCI was in a bearish downtrend last week where it opened last Monday 0.67 of a point lower at 1,808.21 and slipped lower on continued selling pressure to close 11.68 points
Lower at its intra-day low of 1,797.2 points as investors remained cautious over the uncertainties of the global economy. The FBMKLCI rebounded to close 0.82 of a point lower at 1,796.38 points on Tuesday after hitting an intra-day low of 1,790.99 as Investors remained on the sidelines on concerns over the possibility of the US Federal Reserve ending its bond-buying program this month. Wednesday saw the benchmark FBMKLCI ended 9.54 points lower to close at 1,786.84 after the recent International Monetary Fund's (IMF) move to revise downward its forecast on global growth to grow by 3.8% next year compared to its earlier forecast of 4% in July has put pressure on demand for the stock markets, and Thursday saw the FBMKLCI plunging 19.07 points or 1.07% lower at the intra-day low of 1,767.77 for the fifth consecutive days as the market suffered heavy losses on continued technical correction. Nevertheless, the FBMKLCI staged a strong rebound on Friday after hitting the intra-week low of 1,766.22 to close 20.54 points or 1.16% higher at 1,788.31.
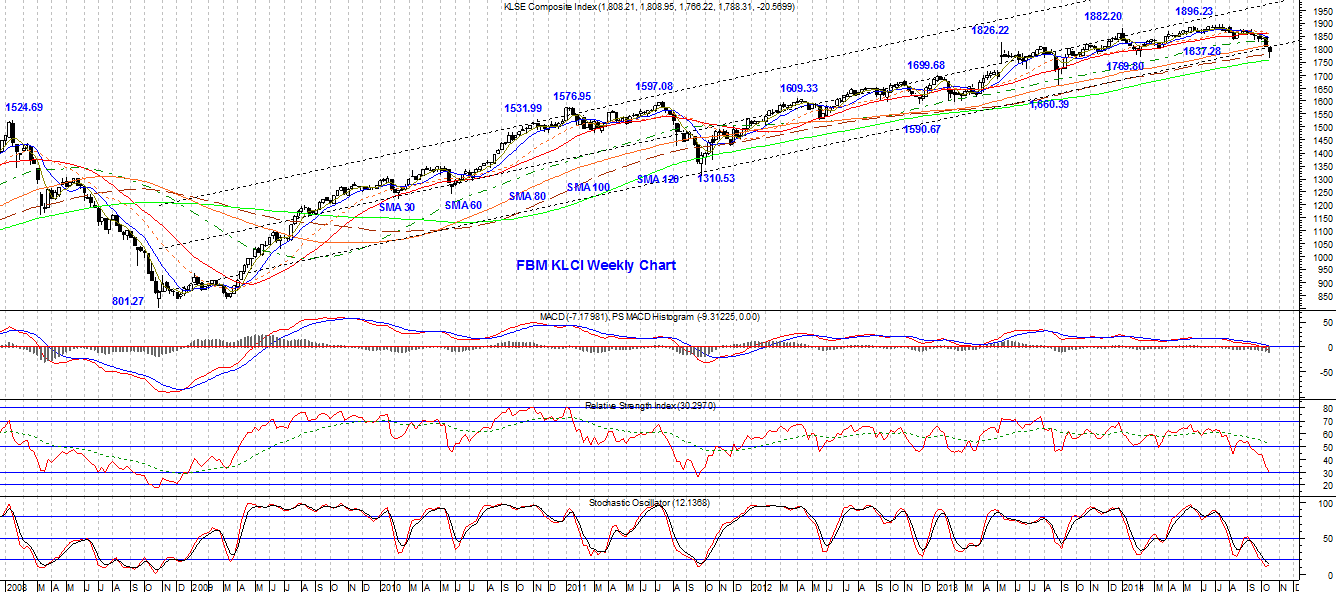
On the weekly chart, the FBMKLCI formed a black hammer-like candlestick which closed at slightly above the midrange of the week of 1,787.58, indicating a fight back of the bulls. Hence, the FBMKLCI is likely to stage further rebound in the coming week. However, the rebound was still not that strong as of last Friday’s closing, and hence, the key index is likely to stay in range-bound consolidation until it breaks the overhead resistance zone of 1,800 to 1,808 points. On the daily chart, the FBMKLCI formed a bullish engulfing candlestick pattern which is a key bottom reversal pattern which indicates a fight back of the bulls after being beaten down for five consecutive sessions. Hence, the FBMKLCI is likely to stage further rebound today with strong overhead resistances expected at 1,801, 1,808 and 1,822, and the downside support zone is at 1,780 to 1,766.
Weekly MACD and its histogram continued to slide lower, indicating an increased in the weekly bearish momentum. Daily MACD was marginally lower and showed sign of tapering off, while its histogram contracted upward strongly for the first bar after falling consecutively for five bars, indicating a strong rebound. Weekly RSI (14) was lower at 30.3 from 34.7, indicating very bearish weekly relative strength. Daily RSI (14) swung up strongly to 31.5 from 16.2, indicating very strong rebound technical rebound which changed the FBMKLCI’s short term relative strength from an extremely bearish to a bearish state. Weekly Stochastic hooked upward to 12.1 from 10.6 but is still below the slow stochastic line, indicating a rebound on the weekly chart. Daily Stochastic swung upward to 19.1 from 2.5, and has made a golden-cross over the slow stochastic line, issuing a stochastic buy signal, and indicating the possible beginning of a short term up cycle. In short, readings from the weekly indicators showed that the FBMKLCI is still in a very bearish state. However, reading from the daily indicators showed that the FBMKLCI was staging a strong rebound after hitting the deeply oversold zone on both the RSI and Stochastic indicators, and is likely to stage further rebound.
The general trend of the FBMKLCI still remained down and bearish as the key index continued to stay below the short, medium and long term moving averages. However, the FBMKLCI staged a strong technical rebound last Friday after breaching the very long term 500-day simple moving average (SMA), but that is still not able to reverse the current downtrend yet. In order to reverse the current downtrend, the FBMKLCI will have to recover at least fifty percent of the current downtrend range from 1,896.23 to 1,766.22, to close above the mid-range level of 1,831 and a full recovery would require the FBMKLCI to close above the 120-day SMA which is currently at 1,864. Looking forward, the FBMKLCI will have to first move above the 1,800-point psychological level in order to maintain its very long term uptrend posture, otherwise, more downward pressure will drag the FBMKLCI to the 1,700 to 1,725-points level.
Last Friday, the Dow rose 263.17 points or 1.63% to close at 16,380.41. This week, the FBM KLCI is likely to trade within a range of 1,723 to 1,851, and today, the FBM KLCI is likely to trade within a range of 1,742 to 1,824.
This week's expected range: 1723 – 1851
Today’s expected range: 1742 – 1824
Resistance: 1800, 1812, 1824
Support: 1742, 1754, 1771
Stocks to watch: BSTEAD, GHLSYS, GTRONIC, IFCAMSC, INARI, JIANKUN, KSSC, MAHSING, MEGB, MFCB, MUDAJYA, MUIPROP, MYEG, SCICOM, SUPERMX, TEKSENG, VS
Disclaimer: The content on this site is provided as general information only and should not be taken as investment advice. All site content, shall not be construed as a recommendation to buy or sell any security or financial instrument. The ideas expressed are solely the opinions of the author. The Stocks to watch is not a recommendation to buy or sell the particular stock, as it is only meant for graduates of the "Share Trading the Pro Way" course as case study. Any action that you take as a result of information, analysis, or commentary on this site is ultimately your responsibility. Consult your investment adviser before making any investment decisions.