 Stocks on Bursa Malaysia closed higher last Friday as blue-chips consolidated and small-capitalised stocks' rotational interest continued on positive global economic data and rising commodity prices. The FBMKLCI rose 2.93 points or 0.16% to close at 1,830.74, after moving between 1,826.44 and 1,831.32 throughout the day. Week-on-week, the key index gained 11.37 points or 0.62% from 1,819.37 on previous Friday. Gainers outnumbered losers by 457 to 366, while 340 counters were unchanged. Volume fell to 2.98 billion shares worth RM2.39 billion from 2.99 billion shares worth RM2.5 billion on Thursday. Weekly turnover amounted to 15.750 billion shares worth RM12.181 billion, compared with previous week’s 2.18 billion shares valued at RM3.73 billion.
 The FBMKLCI was basically in a sideways range-bound mode with an upward bias last week. The FBMKLCI opened last Monday 0.32 point higher at the intra-week low of 1,819.69 and rallied higher to hit the intra-week high of 1,833.39 within the first thirty minutes after opening, and the key index pulled back to consolidate with a gain of 8.11 points at 1,827.48 points. The FBMKLCI slipped 2.24 points on Tuesday to close at 1,825.24 after hitting an intra-day low of 1,822.68 following the weaker performance on regional markets as the foreign fund exodus continued. Wednesday saw the FBMKLCI which was hovering in the negative territory for most part of the day was lifted by last minute buying in plantation counters in response to palm oil prices which have been rising over the last two weeks to close 4.21 points higher at 1,829.45. The FBMKLCI retraced 1.64 points to 1,827.81 on Thursday despite robust trading in small-cap and penny stocks. However, the key index managed to stage a rebound on Friday to close the week with a weekly gain of 11.37 points at 1,830.74.
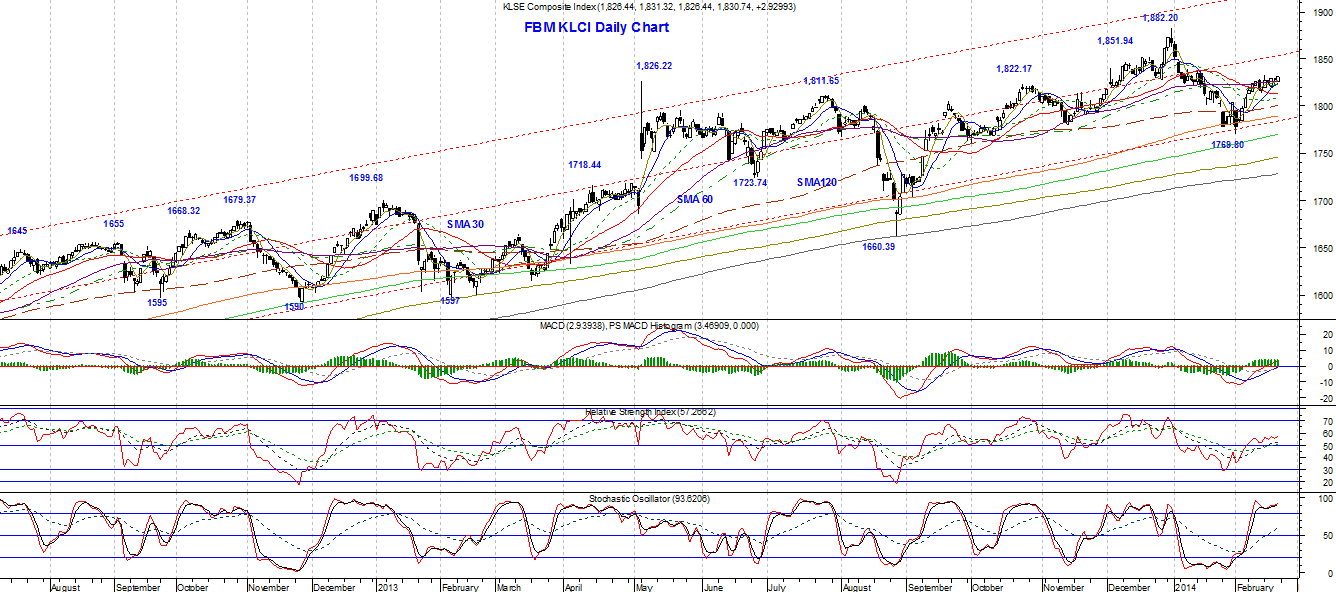
On the weekly chart, the FBMKLCI formed a bullish white candlestick which continued the uptrend from previous week. Hence, the key index is likely to continue its uptrend to move higher this week. On the daily chart, the FBMKLCI formed a bullish white candlestick which reversed the downward move on Thursday, and hence, the FBMKLCI is likely to continue its upswing to move higher. Immediate overhead resistance zone is at 1,833 to 1,838, while the downside support zone is at 1,820 to 1,813.
Weekly MACD hooked upward gently for the first time after sliding southward continuously for seven week, and its histogram also further contracted upward, indicating a first sign of reversal of the weekly momentum from down to up. Daily MACD continued to rise, but its histogram further contracted southward, indicating the FBMKLCI is still in a consolidation mode on the daily perspective. Weekly RSI (14) was higher at 58.6 from 55.8, indicating a further improvement in the weekly relative strength in the mildly bullish zone. Daily RSI (14) was higher at 57.3 from 55.9, indicating further improvement in the daily relative strength in the mildly bullish zone. Weekly Stochastic rose to 44.3 from 34.8 after making a golden-cross the previous week, indicating further strengthening of the index’s strength and continuation in the weekly up cycle. Daily Stochastic was higher at 93.6 from 90.7, indicating short term strength in the FBMKLCI, but is moving into the overbought zone, and hence, a correction might be expected. In short, readings from the weekly indicators showed that the FBMKLCI has just started to turn strong, while signals from the daily indicators’ readings showed a state of consolidation with an upward bias.
The short term trend of the FBMKLCI is sideways range-bound with an upward bias as the key index continues to move within a narrow range of 1,819 to 1,833 and its short term 5-days simple moving average (SMA) is staying above all other moving averages. The medium term trend is also sideways range-bound as the key index continues to hover around the mid-range of a larger range of 1,769.8 to 1,882.2. The long term trend, nevertheless, still remain up. For the coming week, the FBMKLCI is likely to continue with its range-bound move until a breakout is seen on either side of the immediate short term range of 1,813 to 1,833, a breakout from the 1,833 overhead resistance may see the key index moving higher to test the next resistance zone of 1,838 to 1,850, while a break below the 1,813 support will see it sliding lower to the 1,800-point psychological support level. Nonetheless, as the blue-chips continue to consolidate, rotational play on small-cap and penny stocks is likely to continue.
Last Friday, the Dow fell 29.93 points or -0.19% to close at 16,103.30. This week, the FBM KLCI is likely to trade within a range of 1,808 to 1,847, and today, the FBM KLCI is likely to trade within a range of 1,822 to 1,836.
This week's expected range: 1808 – 1847
Today’s expected range: 1822 – 1836
Resistance: 1832, 1834, 1836
Support: 1822, 1824, 1827
Stocks to watch: A&M, ACME, ANCOM, ASUPREM, BIG, CATCHA, ENCORP, FITTERS, SEALINK, SENDAI, SILKHLD, UOADEV
Disclaimer: The content on this site is provided as general information only and should not be taken as investment advice. All site content, shall not be construed as a recommendation to buy or sell any security or financial instrument. The ideas expressed are solely the opinions of the author. The Stocks to watch is not a recommendation to buy or sell the particular stock, as it is only meant for graduates of the "Share Trading the Pro Way" course as case study. Any action that you take as a result of information, analysis, or commentary on this site is ultimately your responsibility. Consult your investment adviser before making any investment decisions.